
Web.com for enterprise: Product Design
A best in class product for enterprise businesses
“Web.com For Enterprise”(WFE) is a brand management, campaign creation and BI tool that allows you to create, customize, and review your campaign’s performance across your entire network through a dashboard of performance data.
Role: Design Direction, Tester

Overview
The WFE product, whose growth was generated by the need of customers to analyze their marketing data, was seeing churn rates increase, lower and lower engagement, and new customer acquisition slow. A customer need was not being met and we needed insights to understand it.
A “jobs to be done” framework was used along with customer support interviews to help understand the problem. The key takeaways were:
1. Customer’s needed to access their data on the go and from anywhere and at the time our product was not responsive
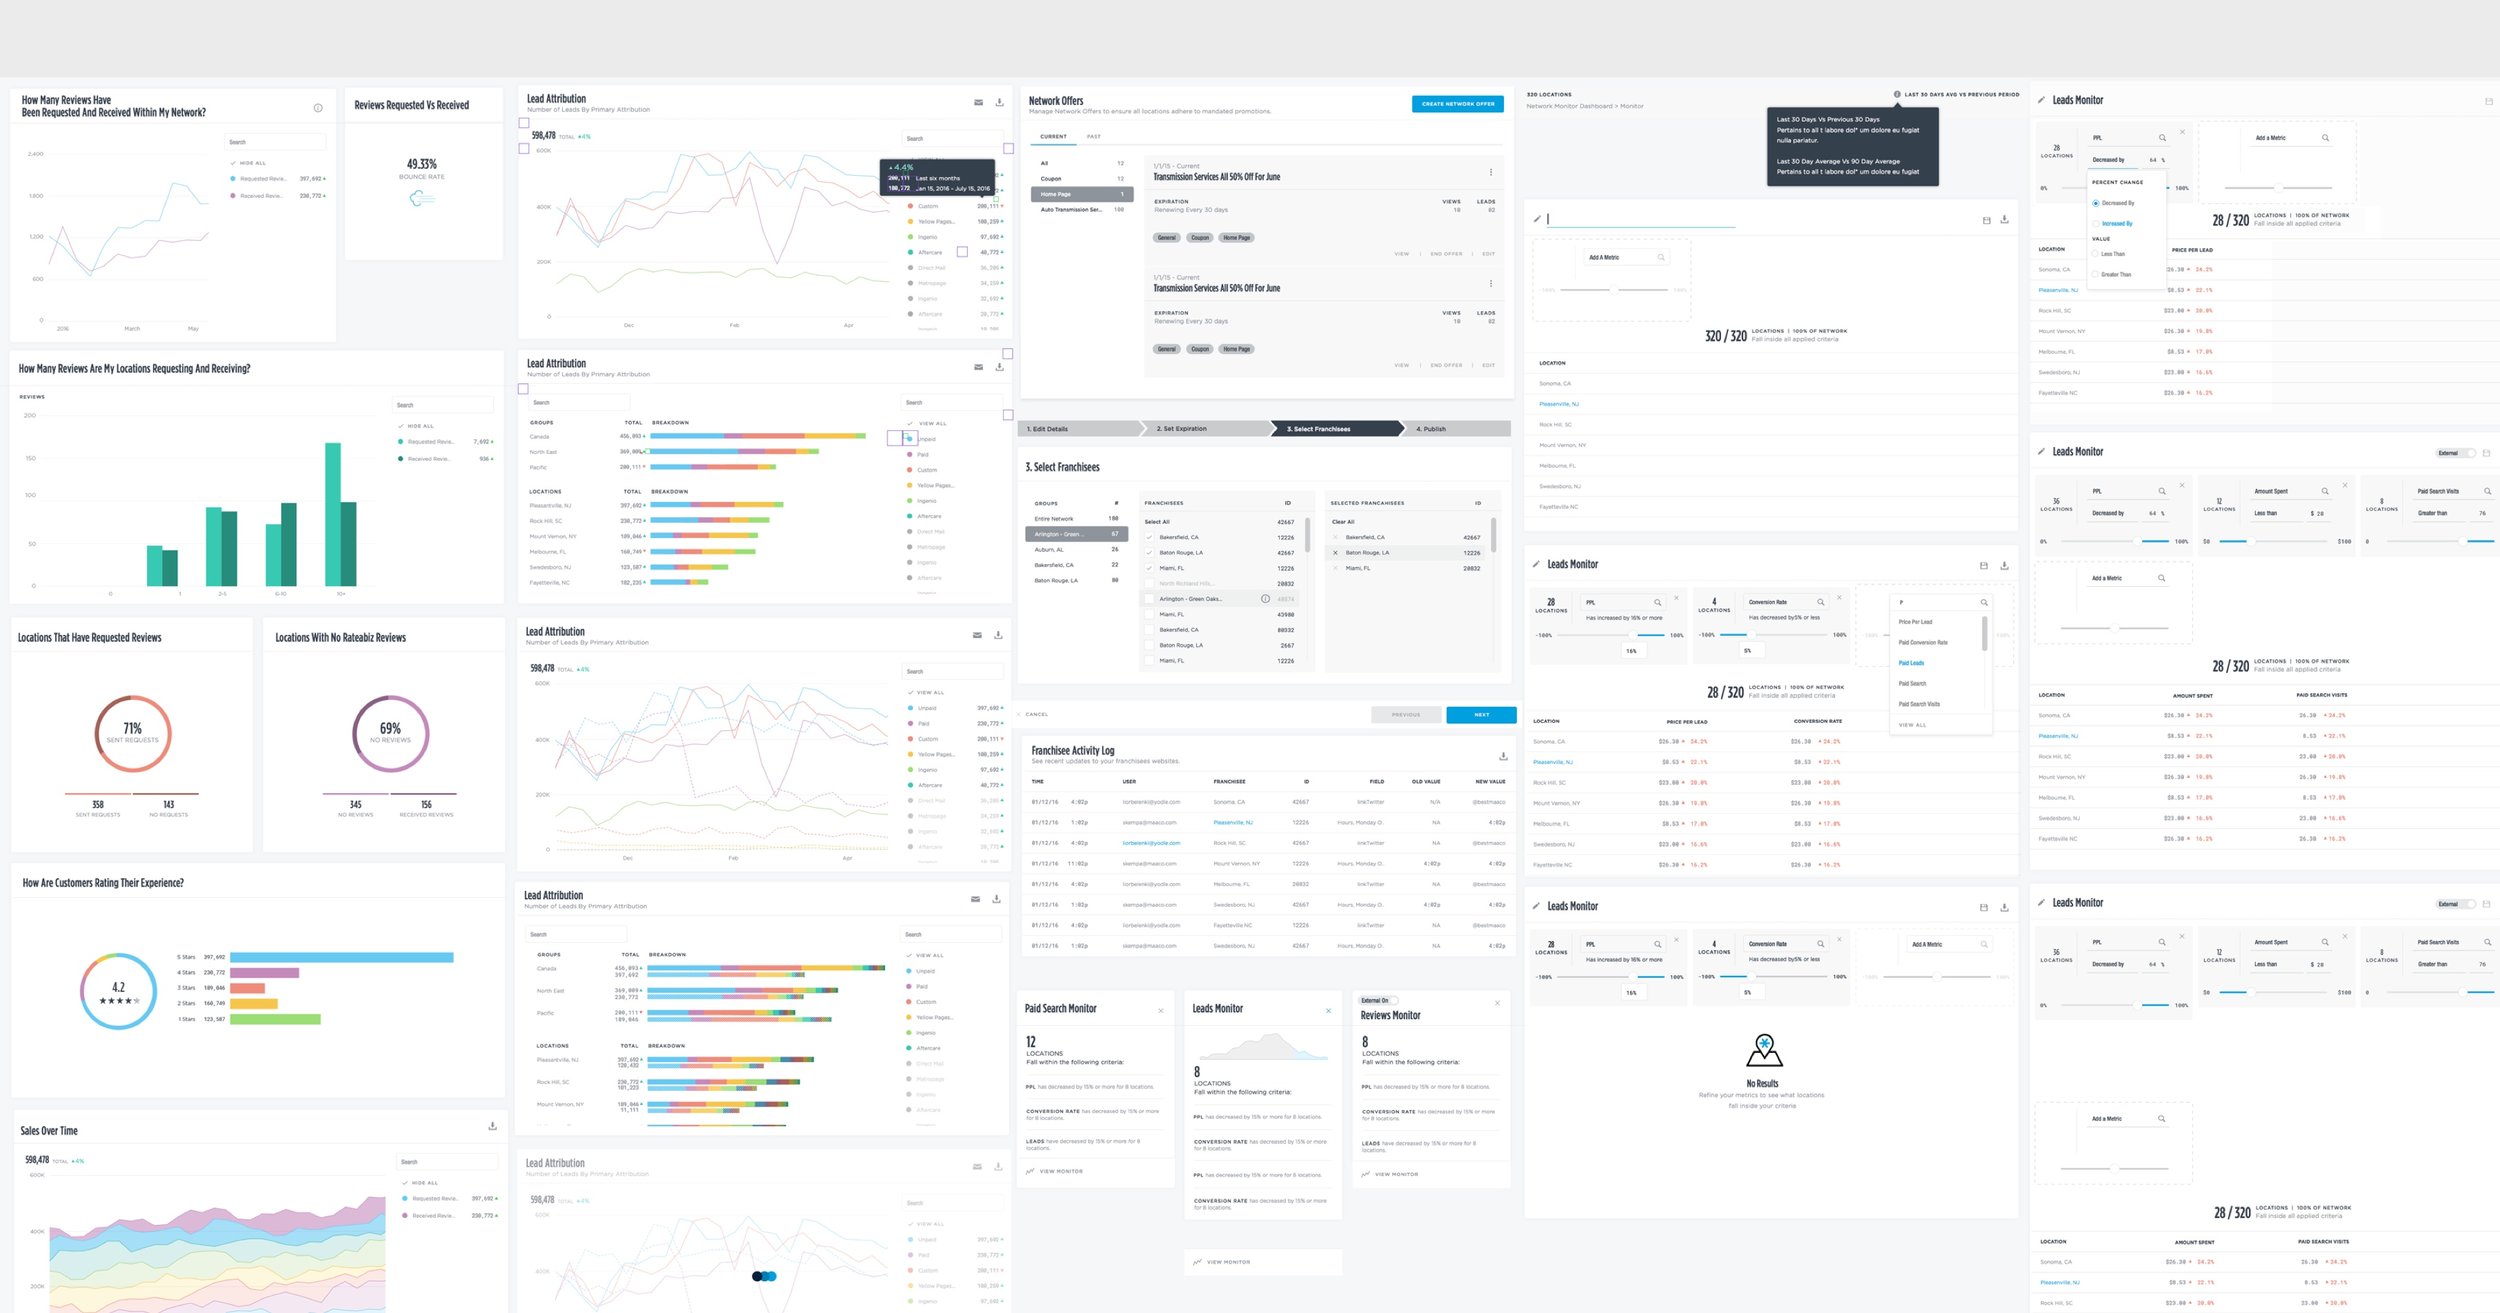
2. The product allowed customers to look at their data but what they needed was ways to organize and analyze it
3. The cost versus the product look & feel didn’t match expectations. Customers were spending millions on a product that used generic charts and graphs set in dated UI

Research, testing, & validation
The design team developed a plan that broke down into these steps:
Step 1: Research proven data delivery mechanisms (digital & traditional) including annual reports, trading tools, newspapers, and additional financial tools.
Step 2: Develop UI, VisID and other design recommendations based on the collective research and codify those recommendations into prototypes to test.
Step 3: The team ran the prototypes through both moderated and unmoderated testing, including getting reactions from current and churned customers.

What the team learned
Overall, there was a drastic increase in overall sentiment with the product and increased approval of the brand. Customers and testers were more prone to engage with the data and tools as well as provided positive feedback on the responsive nature of the product.

Initial release & further validation
The team saw dramatic increases in customer engagement and customer support team flooded with positive feedback.
82% increase in user engagement
700% increase in session time (average session time increased from 1 minute and 30 sec to 10 min and 42 sec)

Building The Roadmap
Based on the initial research and further customer feedback, the team was tasked to improve the product experience by rolling out these features:
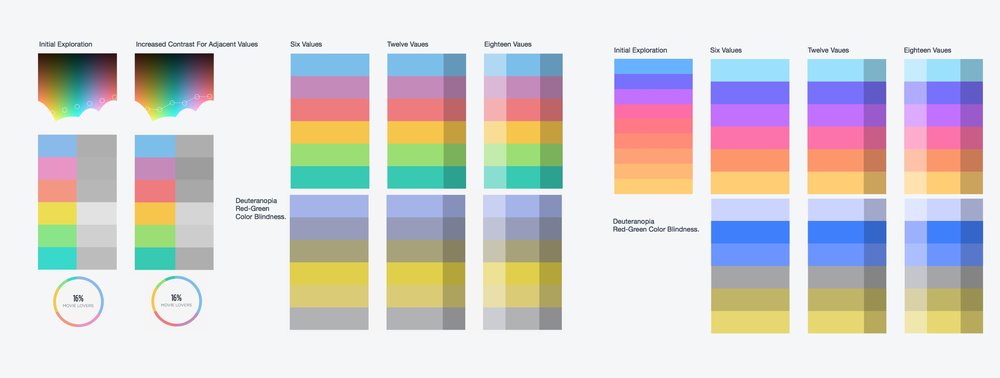
1. Accessible color scales for data visualization
2. Design system for efficiency
3. Fully responsive mobile experience
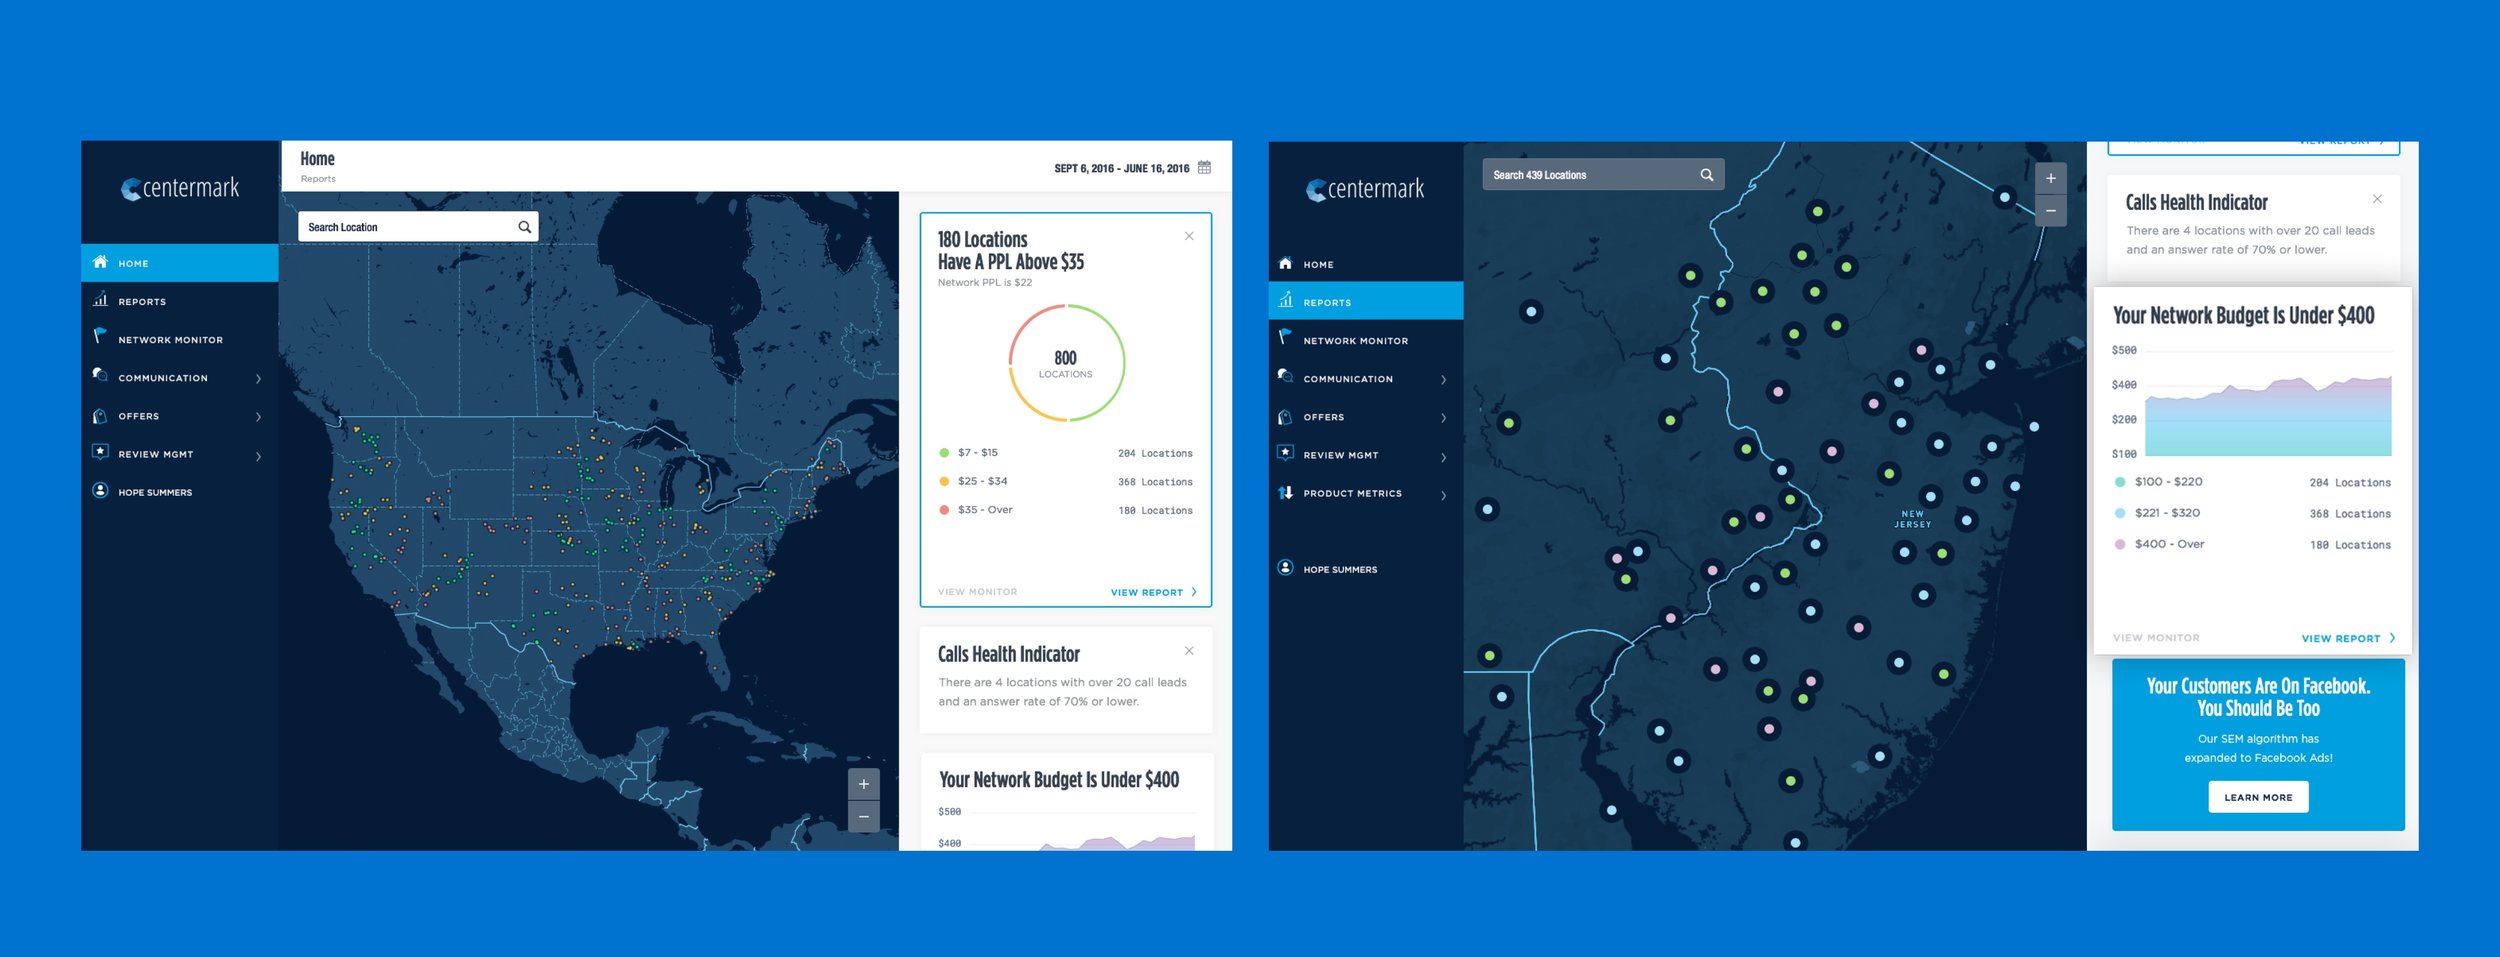
4. Better network visualizations


Improvement Scores
Through understanding our customer’s needs and perceptions the team made improvements across many key categories, most importantly a 17% increase in YOY revenue growth.
